In this note additional comments on musical noise artifacts are included. The original short article entitled “Musical Noise in Acoustic Noise Reduction” addresses covers fundamentals of musical noise and it serves as a reference.
The term “musical noise” (MN) was coined relatively long time ago when Boll’s Spectral Subtraction approach (1979) to noise reduction became a method of choice. It has been a common observation that MN is inherently characteristic to the spectral subtraction; sub-band variants of spectral subtraction also suffer from MN.
Yet, different methods of mitigating, or even addressing “at source”, various aspects of MN manifestations do not have equally long history. The reason involved solutions (including noise reduction solutions equipped with additional features targeting MN plus post-processing operations) are costly numerically. One may then observe that these methods started flourish only in late nineties that is significantly after first single-chip DSP processors came into the field of voice enhancement.
General characterization of MN effect is that this is a nonlinear effect that manifests as a rapid ascent and descent of signal components at frequencies that are not present (or are virtually absent) in the original audio streams (i.e., prior to processing it by a noise reduction component). These varying sounds result in tonal disturbances of an unnatural quality.
There are several causes of MN. In general terms, these causes stem out from manipulations over the signal spectrum via nonlinear operations. This is why is not surprising to observe that other versions of noise reduction, for example, versions based on Blind Signal Separation (BSS) are also prone to MN phenomena. Even other voice enhancement devices, such as frequency-domain-based echo cancellers, may, under certain conditions, manifest traces of MN.
While the subject of identification and mitigation of MN is an important part of voice enhancement solutions and it deserves a separate treatment from the viewpoint of describing the state-of-the-art of this technology, not necessarily for a specialist, but for the general practitioner, here we want to limit the scope to sharing additional observations of MN manifestations within BSS-based solutions.
Here are then presented a couple of cases, as viewed in spectral domain, illustrating graphically the presence of MN in BSS-based solutions, and then they are contrasted with similar cases where successful mitigation of MN was achieved.

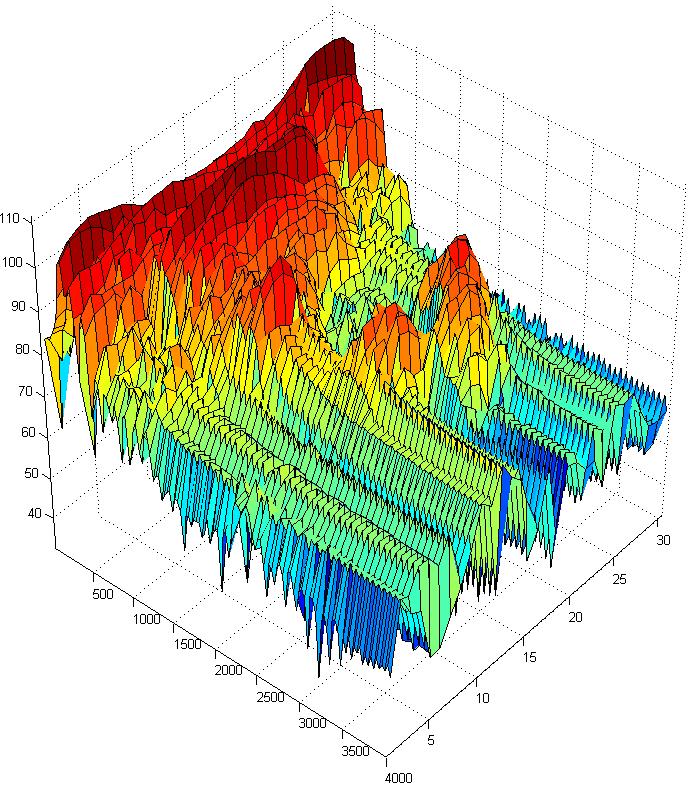
Figure 1 depicts a typical case of MN. The vertical scale is in dB’s. The frequency range is linear scale, covering the narrow band, i.e., [0, 4000Hz]. The observation time is in frames, from 1 through 30, covering the equivalent time duration of 1 second. (Reference: test vector #5).
In Figure 1, there are no traces of MN until frame 12. Then, starting from this point “foreign” energy moving from the band [2150 Hz,2600 Hz] to [2500 Hz, 2850 Hz] and then back to [2150 Hz,2600 Hz] and in the process it reaches levels comparable with low-frequency formants (namely, only 8-10dB lower). This is contrast with a non-MN case depicted in Figure 2.

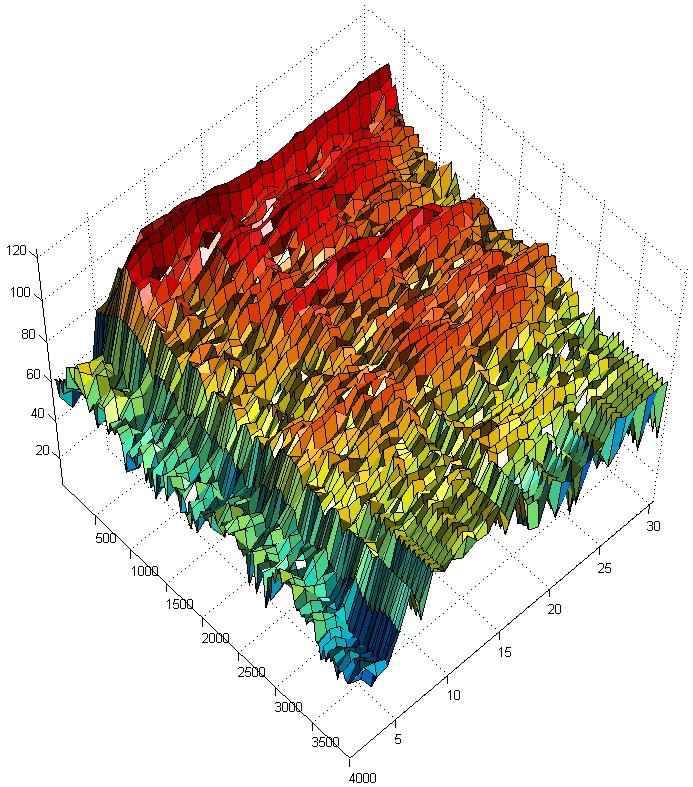
Figure 2 illustrates a case where no traces of MN are observed. (Reference: test vector #4). Similarly to Figure 1, the frequency range is linear scale, covering the narrow band, i.e., [0, 4000Hz]. The observation time is in frames, from 1 through 30, covering the equivalent time duration of 1 second. As recognized from the spectral pattern, the present speech segment contains unvoiced sound (Reference: test vector #4).
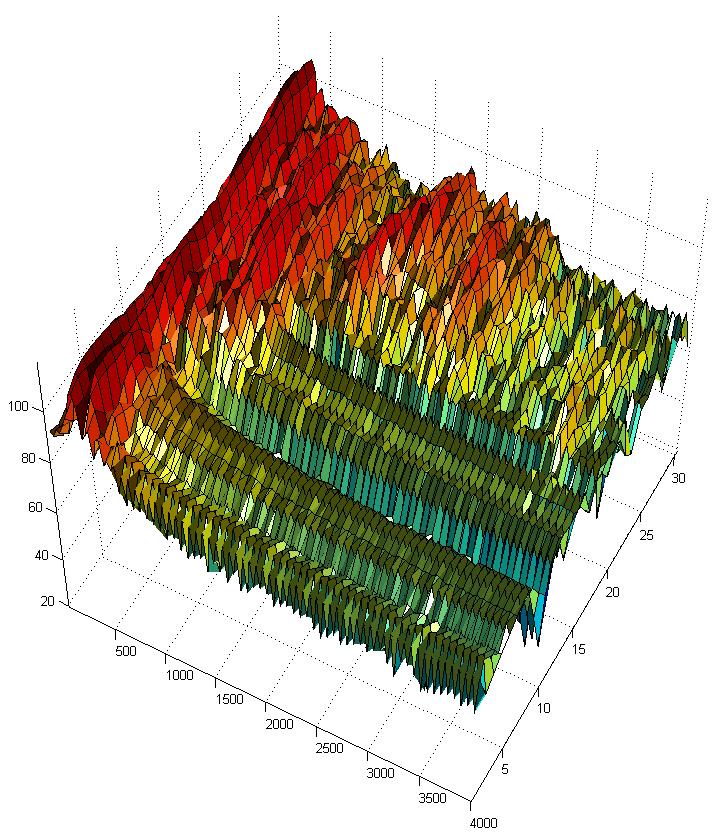
In Figure 3 another case of non-MN is illustrated. There we observe a transition from the voice sound the combination of voiced and unvoiced components.

In Figure 4 there is a comparison between two similar (in terms of verbal contents) speech segments, in the frequency-time representation. In the frequency band, f > 1500Hz, we observe the high energy locations vary relatively rapidly, from utterance to utterance.

VOCAL’s Voice Enhancement solutions are designed to minimize any potential traces of musical-noise occurrences. They been successfully tested in typical acoustical environment and deployed widely.