Signal de-correlation, signal whitening, or signal pre-whitening can be done on a signal, or on a pair of signals which results in the autocorrelation or cross-correlation function having smaller values without too much of an adverse effect on the signals themselves. Signal de-correlation can be a linear process or a non-linear process.
Depending on the application, advantages of signal de-correlation vary and resultant effects vary as well. For example, signal pre-whitening improves NLMS-based adaptation process. Signal de-correlation applied to two microphone signals in Blind Signal Separation (BSS) contributes to improvements of BSS-based noise reduction.
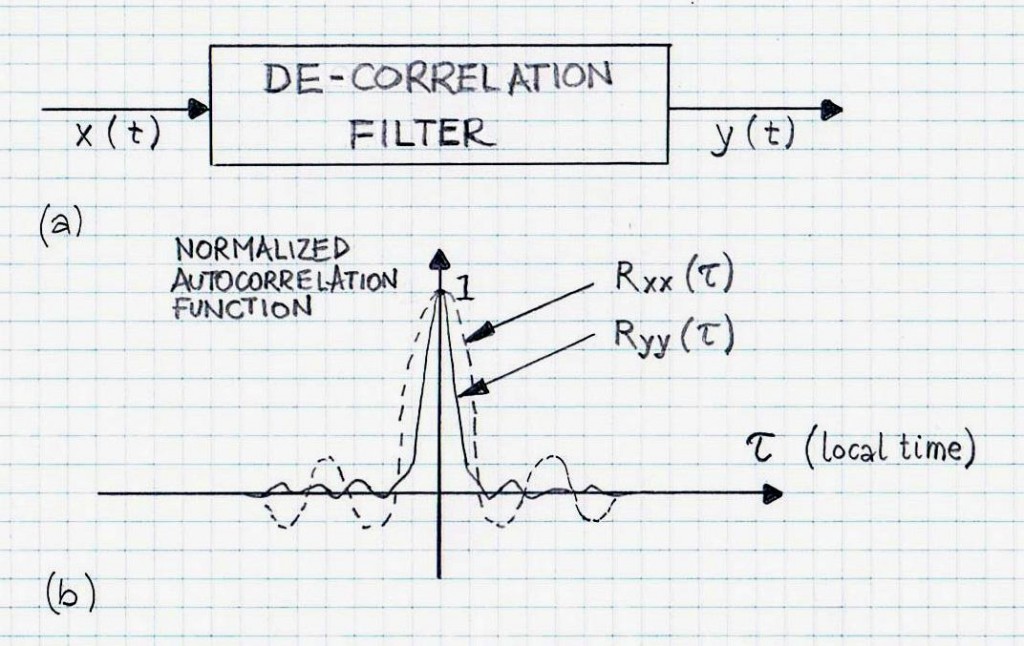
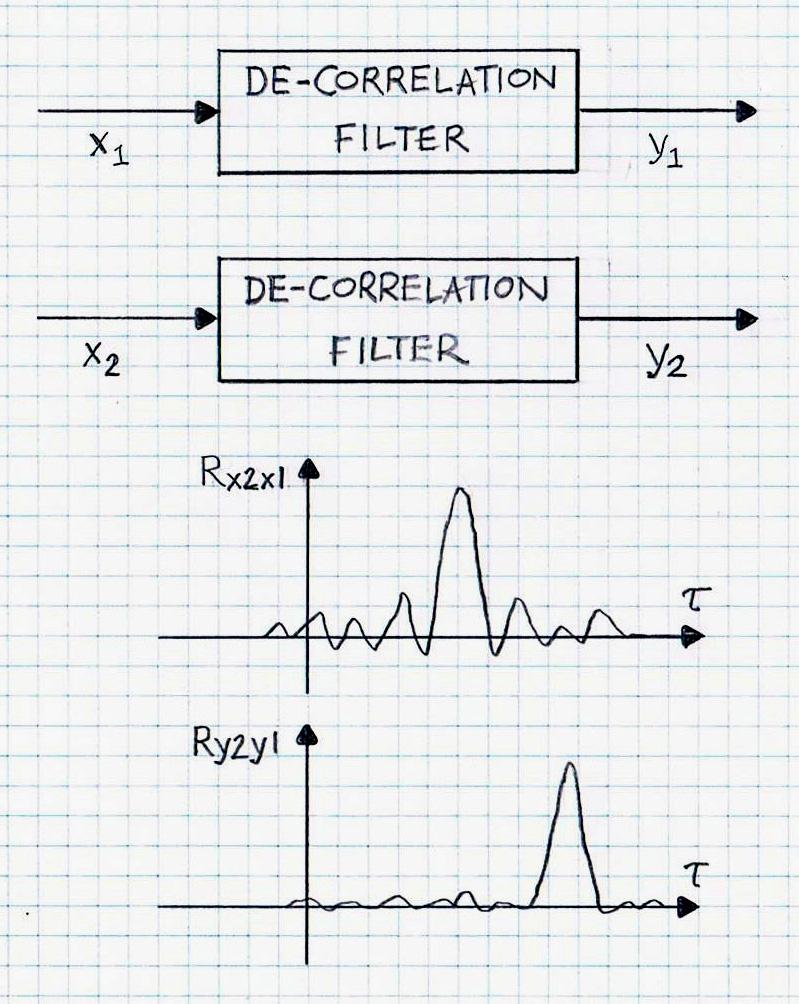
One of the standard examples of linear signal whitening is shown in Figure 1, where the de-correlation filter (either a linear filter, LF, or non-linear filter, NLF), is designed to minimize the auto-correlation of the output, without too much of the adverse effects produced by amplitude and phase characteristics. In general, the de-correlation filtering can be a linear process (such as linear spectrum shaping or linear prediction filtering, LP) or a non-linear process (such as linear prediction coding, LPC). Figure 2 illustrates signal de-correlation for a pair of signals x1(t) and x2(t).

Non-linear de-correlation can be accomplished in various methods. One of the simplest approaches is the method of introducing non-linear distortions via a memoryless polynomial linking output to input. If not carefully designed, these are “draconian” approaches that can have adverse audible effects. A more gentle approach is by using a Linear Prediction Coding method. Other methods include frequency varying and time varying. It is noted that not always do the positive effects of non-linear de-correlation outweigh the adverse effects. Therefore, considerable attention to the specific approach’s details, including tuning of the non-linear transformation parameters is required.
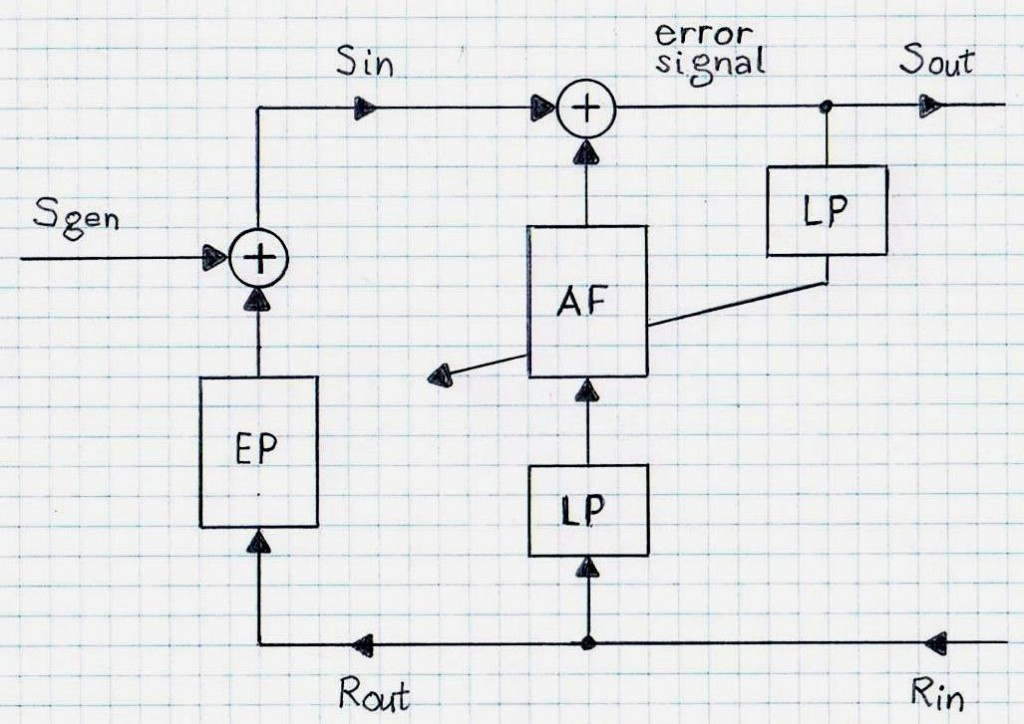
An example of de-correlating signals to adaptive filtering is shown in Figures 3 and 4. The Least Mean Square (LMS) algorithm is dependent on the eigenvalue distribution of the reference input correlation matrix. In general, techniques for improving the convergence rate through de-correlation are based on: (1) Spectral emphasis and (2) Decimation of the subband signals , and (3) Linear Prediction (LP), among other things.

These methods are based on theoretical relationships between eigenvalue distribution and convergence characteristics. An application of LP to the reference signal and the error signal; in echo cancellation is illustrated in Figure 3. The reference signal (Rin) and the error signal are transformed by LP blocks, before they are applied to the AF block.

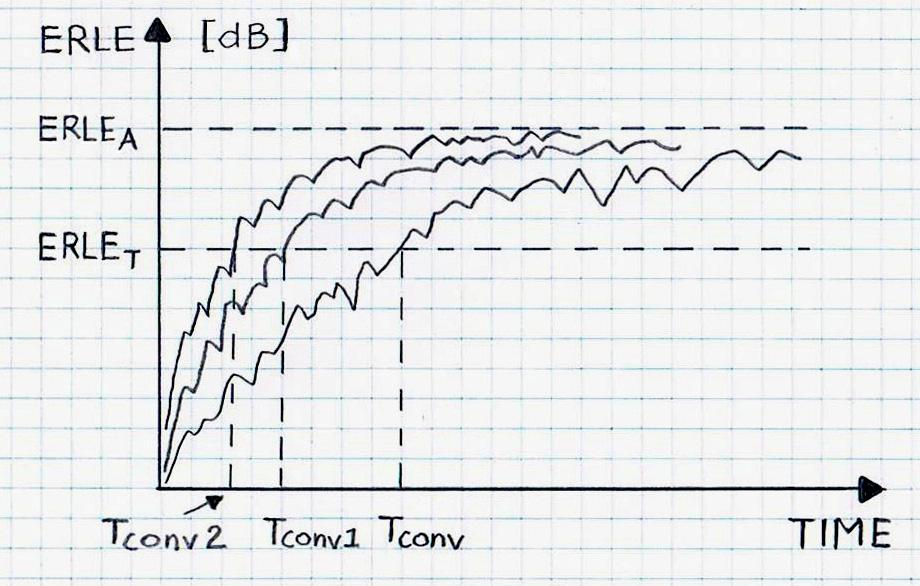
Figure 4 illustrates the AF convergence speed increase when employing LP filters. The speed is measured using the time (of the number or iterations) needed to achieve a predefined ERLET. ITU-T G.168-2015 defines ERLET as 14 dB (for test cases with NLP turned OFF). The convergence speed shows improvements, as indicated by two benchmark results, Tconv1 and Tconv2, compared to Tconv, when no de-correlation was used.
VOCAL Technologies’ robust acoustic echo cancellation and noise reduction/cancellation solutions provide fast convergence for typical use cases. Where justified, signal de-correlation transformations can be included to address specific use cases. Contact us to discuss your speech/audio application.