Voice Activity Detection (VAD) can be used for dereverberation to determine the speech reverberation estimation time. A VAD algorithm should include functions for feature extraction, decision and decision smoothing. Using multiple features with adaptive thresholds and robust decision smoothing, VAD errors can be greatly reduced. In general examining more features in dynamic audio environments can lower the probability of false alarms but may also increase the miss probability.
A Voice Activity Detector is any collection of methods meant to segment a speech signal into Voiced, Unvoiced, and Noise frames. In general, any VAD has three component parts: the Feature Extractor, the Decision Module, and the Decision Smoother. These parts fit into the overall VAD system as follows:
Figure 1: VAD Block Diagram [1]
This general block structure gives the designer increased flexibility in creating a custom VAD solution. The lion’s share of this flexibility comes from the multitude of available features, each robust under certain conditions, and the decision region boundaries.
Feature Extraction
In general, a feature is any parameter of a speech signal that can be used to make the requisite decision. A good feature is one that is reliable, often said to be robust, in the presence of noise. Here we will consider some commonly used features and touch on how they can be used to discriminate between speech types.
Frame Energy
Perhaps the most conceptually simple feature, the current speech frame energy E is defined as:
![]() (1)
(1)
Where N is the frame length, m is the frame index, and ![]() is the windowed time domain speech in question. The basic idea is that speech + noise frames will have energy much higher than noise only frames, and this distinction forms the general outline of the decision region. The exact boundary is up to the designer, but is often a simple threshold. In addition, some benefit may be gleamed from using the logarithm of the energy instead or the energy in various subbands.
is the windowed time domain speech in question. The basic idea is that speech + noise frames will have energy much higher than noise only frames, and this distinction forms the general outline of the decision region. The exact boundary is up to the designer, but is often a simple threshold. In addition, some benefit may be gleamed from using the logarithm of the energy instead or the energy in various subbands.
Obviously, as the signal to noise ratio (SNR) decreases, the energy in the noise only frames becomes comparable to that of the speech + noise frames. In this case, the probability of error rises, and therefore this feature is not robust to interference in general.
Zero Crossing Rate
The Zero Crossing Rate (ZCR) measures the number of times the amplitude of the time domain signal changes sign. It is defined as:
The idea is that when the zero crossing rate is large, the current frame m is likely unvoiced or noise, while the current frame is likely voiced when the zero crossing rate is high. This is because unvoiced/ noise frames typically contain high frequencies of comparable power to those at the lower end of the spectrum, while the power in voiced frames is typically concentrated in low frequencies. Again, as the SNR decreases, the speech starts to take on more noise like characteristics, therefore increasing the zero crossing rate. In addition, correlated background noise (for instance in double talk situations) or low frequency or tonal interference will give this method trouble due to artificially decreasing the rate thereby leading to an increased probability of error.
Normalized Auto-Correlation Coefficient
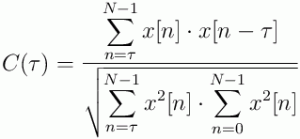
The Normalized Auto-Correlation (NAC) Coefficient at lag τ measures the correlation between samples spaced τ samples apart. It is defined as:
The premise is that closely spaced samples (τ = 1) in voiced frames are often highly correlated, while samples in unvoiced frames are less so, and those in noise only frames are the least correlated if not totally uncorrelated. Therefore, we should expect to see a C(τ) ≈1 while C(τ) ≈ 0 for unvoiced or noise frames.
This method begets more confidence in low SNR under additive uncorrelated noise, as the underlying voiced signal should still be present. However, under correlated interference this method is behaves badly. Interestingly, this bad behavior can be turned into a virtue under the correct interpretation.
Auto-Correlation Periodicity
The autocorrelation of a periodic function has periodicities in itself. A truly periodic function will have a periodic autocorrelation that repeats forever. A periodic signal corrupted with noise will have a periodic autocorrelation whose undulations decrease in amplitude across lags. An aperiodic signal, like noise, will have an autocorrelation devoid of periodicity. A truly uncorrelated signal will have an autocorrelation that is a delta function centered at lag zero.
We can use this difference to create another measure by considering the extremes of a truly periodic versus a truly uncorrelated signal. Since a truly periodic signal will have a repeating autocorrelation while a trule uncorrelated autocorrelation will manifest as a delta function, the energy present in all non-zero lags will be zero for the uncorrelated signal while it will be high for the periodic signal. In the presence of uncorrelated noise, this method will degrade for voiced segments, while correlated noise will degrade this measure for unvoiced or noise segments.
To get around this performance degradation, we can examine the fourier transform of the autocorrelation function, which is the power spectrum of the original signal. The power spectrum of a voiced segment will have more energy in the lower frequency half band than the higher frequency half band. An unvoiced frame or a noise frame will tend towards the opposite.
In addition, the power spectrum of voiced speech will have a formant structure. Therefore, we can examine the fourier transform of the power spectrum to help make our decision. The second fourier domain will have more energy located in the lower frequency half band than the higher frequency half band for voiced speech. Unvoiced speech and white noise will have a flatter second fourier domain.
Detection Module
The detection module can make or break your VAD. Even with a robust feature, a poorly designed detection module will cause an unacceptable probability of error. For example, the same energy or zero crossing rate threshold across two different SNRs will perform differentially. Fortunately, there are ways to optimally estimate the desired threshold.
Optimal Thresholding via Descriptive Statistics
The basic idea here is to use lots of data to hone in on the optimal thresholds. To evaluate a VAD algorithm, you first need to manually segment clean speech signals into regions hit by the error criterion. By introducing carefully modeled distortions, noisy speech is created on which to test your algorithm. There are various criteria to test against, and these will be briefly mentioned now.
Error Criteria
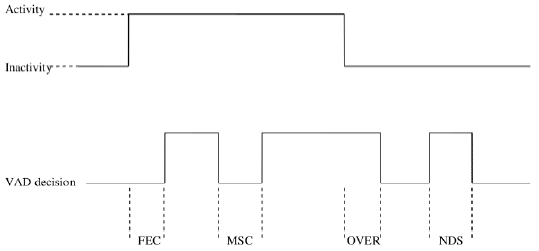
Figure 2: VAD Parameters [2]
As [2] illustrates, the first criterion to use is Front End Clipping (FEC). FEC represents a miss for your detector when passing from noise into speech. FEC is calculated as:
Where NM is the number of speech samples misclassified during noise to speech transitions, and NS is the number of samples in that transition region.
The next error criterion is Mid-Speech Clipping (MSC). MSC represents a miss for your detector during a speech frame. MSC is calculated as:
Where NM is the number of speech samples misclassified during the speech frame.
The third error criterion is Over Hang (OVER). OVER illustrates the percent of noise misclassified as speech while passing from speech to noise. OVER is calculated via:
Where NM represents the number of misclassified samples and Nn represents the number of samples in the speech to noise transition.
The final error criterion in Noise Detected as Speech (NDS). NDS gives an indication of how much noise is interpreted as speech during silence. NDS is measured via:
Where NM is the number of speech samples misclassified during the silence period, whose samples are represented by NSL.
Using these error criteria, the optimal thresholds can be found via particle swarm optimization or other big data techniques. By using a large corpus of speech data, PSO can adaptively determine the best thresholds for each feature and for each error criterion.
In the absence of a large corpus, thresholds can be estimated adaptively. Often, the median of each measure across the entire signal is considered a decent threshold, as it accounts for outliers better than the mean. Obviously, this thresholding scheme will become more accurate over time, but may change drastically in different environments. Therefore, it is advisable to adapt a short term and a long term median, and check their divergence. If the divergence is great enough, we set the long term median equal to the short term median, and use the long term median for our decisions thereafter whilst continually adapting both as before. Within any given frame, there is a non-zero probability of error for each measure, however by using multiple thresholds, or a linear combination of measures, this probability can be reduced.
Decision Smoothing
Decision smoothing is meant to correct the errors explained in the previous section. One method is the hangover scheme, where speech is assumed to happen for a given time period after a speech frame has been detected. For a given time limit, this method degrades as the noise statistics become less stationary.
Another method is median filtering, where the current frame’s decision is taken as the median of the previous frame, the current frame, and the next frame. This introduces a latency of one frame, but significantly decreases the error probability. Overlapping frames in conjunction with median filtering can reduce latency as well as increase the robustness of this smoother.
Finally, exponential smoothing of the actual feature scores can be used to modify the VAD’s decision. The key idea here is that relative to frame length, voice onset and offset occurs at a larger time scale, and therefore the raw VAD scores will change with relatively clear direction across frames.
Conclusion
Voice Activity Detection is a tough problem that has many proposed solutions. Any VAD algorithm needs a Feature Extractor, a Decision Module, and a Decision Smoother. By combining multiple features and using adaptive thresholds with a robust decision smoother, VAD errors can be greatly reduced. Equally important, but not talked about in this article are the VAD algorithms based on statistical tests. In these methods, the signal is fit to a model of speech versus noise and maximum likelihood tests are performed. These methods can be used in conjunction with the measures explained here to help increase robustness. In general, the more features you examine, the lower your probability of false alarm but may increase your probability of miss due to the highly dynamic nature of audio environments.
References
[1] M. Grimm, K. Kroschel, Voice Activity Detection. Fundamentals and Speech Recognition System Robustness in Robust Speech Recognition and Understanding, Vienna, Austria: I-Tech., 2007, ch. 5, pp. 460.
[2] S. S. Meduri, R. Ananth, A Survey and Evaluation of Voice Activity Detection Algorithms, M.S. thesis, Department of Electrical Engineering, Blekine Tekniska Hogskola, Karlskrona, Sweden, 2011


